
Humanitarian Indicators Registry
Background : The humanitarian indicator registry is complimentary to the Inter-Agency Standing Committee (IASC) Humanitarian Programme Cycle (HPC) reference module. The indicators listed in the registry have been developed by the global clusters. While recognising that indicators cannot be fully standardised across countries, given the vast range of emergencies and country contexts, it is recommended to adopt and use the indicators listed as ‘key’ to allow comparison of needs and response monitoring across countries. Clusters/Sectors at the field level are encouraged to contact their Global Cluster Coordinators for further guidance.
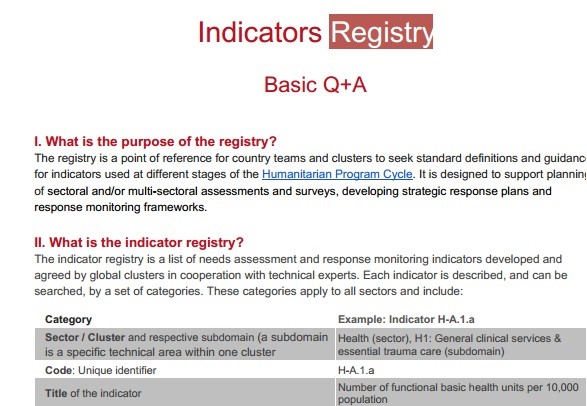
Purpose : The registry is a guidance tool for countries to select indicators, and where possible seek standard definitions and applications of those indicators. It lists the principal needs and response monitoring indicators for each cluster and provides a unique identifier, similar to a p-code, for every indicator. The registry offers also search, filter and export functions.
The reference indicators may be used to track needs over time and to support monitoring along the programme cycle. They can be used for analysis and reporting and may feature in humanitarian needs overviews, strategic planning and monitoring documents, humanitarian dashboards and bulletins.
Scope : This registry is a point of reference for Humanitarian Country Teams and clusters at the country level for indicators which are recommended for monitoring the humanitarian situation, needs and the humanitarian response. The registry does not capture (long-term) impact or input indicators (as many input indicators can feed into one output). There may be other indicators which some global clusters recommend, or other indicators which are only locally appropriate which may not be captured in the registry.
The registry is a guidance tool for countries to select indicators, and where possible to seek standard definitions and applications of those indicators. It lists the principal needs and response monitoring indicators for each cluster and provides a unique identifier, similar to a p-code, for every indicator. This registry is now in the form of downloadable excel below.
| REF | Document Name | Description | Language | Date | Status |
|---|---|---|---|---|---|
| 4a | Humanitarian Indicators Registry | Guidance – Excel | EN | 24 January 2024 | Inter-Agency Agreed |